


Bramesh

Foreign Institutional Investors (FIIs) displayed a Bearish approach in the Nifty Index Futures market by Shorting 9505 contracts worth ₹601 crores, resulting in a decrease of 3405 contracts in the net open interest. FIIs covered 6900 long contracts and added 7126 short contracts, indicating a preference for covering long positions and adding short positions. With a net FII long-short ratio of 2 , FIIs utilized the market rise to exit long positions and enter short positions in Nifty futures. Clients added 16695 long contracts and added 7246 short contracts.
Nifty formed an Outside Bar pattern and The US Fed has cut interest rates by 50 BPS, and tomorrow we have the Sun Trine Uranus aspect, which is crucial for the indices, as discussed in the video below.
The Sun trine Uranus is an aspect often associated with breakthroughs, sudden changes, and innovation. This aspect can indicate unexpected shifts or positive surprises. In financial astrology, Uranus governs sudden disruptions and the breaking of old patterns, while the Sun symbolizes vitality and central authority. When they form a harmonious trine, it can lead to market optimism, technological breakthroughs, or shifts in leadership and policy that affect investor sentiment.
However, these surprises can sometimes trigger volatility or trend reversals, especially when Uranus is involved, as markets may react unpredictably to new developments.
Bulls need to hold 25280 for a move towards the all-time high of 25400/25555. Any break below 25250 could lead to a quick fall towards 25108/25000.
We saw volatlity today with nifty making a new life high and got sold off from morning high. Mid and Small cap bore the brunt with a sharp decline and also recovery in the fag end session showing impact of Uranus. Bulls till holding 25250-25300 range have upper hand to make another rally towards 25555-25610 range. If we go back in History 19 Sep 2003/2013/2017 we made a short term top so Bulls need to break 25611 in next 2 trading session else bears once below 25250 can cause serious damange.

Nifty Trade Plan for Positional Trade ,Bulls will get active above 25444 for a move towards 25524/25603/25682. Bears will get active below 25286 for a move towards 25027/25127/25066.
Traders may watch out for potential intraday reversals at 09:49,11:23,12:34,01:59,02:35 How to Find and Trade Intraday Reversal Times
Nifty Sep Futures Open Interest Volume stood at 1.30 lakh cr , witnessing a liquidation of 2.1 Lakh contracts. Additionally, the increase in Cost of Carry implies that there was a covering of SHORT positions today.
Nifty Advance Decline Ratio at 30:20 and Nifty Rollover Cost is @25178 closed above it.
Nifty Gann Monthly Trade level :25089 close above it.
Nifty closed above its 20SMA @25084 Trend is Buy on Dips till above 25116

Nifty options chain shows that the maximum pain point is at 25400 and the put-call ratio (PCR) is at 1.18 Typically, when the PCR open interest ranges between 0.90 and 1.05, the market tends to remain range-bound.
Nifty 50 Options Chain Analysis
The Nifty 50 options chain indicates that the highest open interest (OI) on the call side is at the 25400 strike, followed by 25500 strikes. On the put side, the highest OI is at the 25200 strike, followed by 25100 strikes. This suggests that the market participants are expecting Nifty 50 to remain range between 25200-25500 levels.
In the cash segment, Foreign Institutional Investors (FII) sold 2547 crores, while Domestic Institutional Investors (DII) bought 2012 crores.
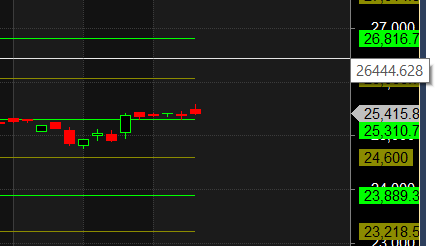
Traders who follow the musical octave trading path may find valuable insights in predicting Nifty’s movements. According to this path, Nifty may follow a path of 23889-24600-25310-26063 This means that traders can take a position and potentially ride the move as Nifty moves through these levels.Of course, it’s important to keep in mind that trading is inherently risky and market movements can be unpredictable.
The biggest The trader’s enemy is fear, Fear generates thoughts and Reactions. And these thoughts and reactions cause when trading often behaviour that leads to unsuccessful behaviour. That is why there is fear the greatest hindrance to success in trading.
For Positional Traders, The Nifty Futures’ Trend Change Level is At 25243. Going Long Or Short Above Or Below This Level Can Help Them Stay On The Same Side As Institutions, With A Higher Risk-reward Ratio. Intraday Traders Can Keep An Eye On 25415 , Which Acts As An Intraday Trend Change Level.
Nifty Intraday Trading Levels
Buy Above 25444 Tgt 25488, 25529 and 25576 ( Nifty Spot Levels)
Sell Below 25400 Tgt 25365, 25333 and 25285 (Nifty Spot Levels)
Wishing you good health and trading success as always.As always, prioritize your health and trade with caution.
As always, it’s essential to closely monitor market movements and make informed decisions based on a well-thought-out trading plan and risk management strategy. Market conditions can change rapidly, and it’s crucial to be adaptable and cautious in your approach.
Related