


Hououin Kyouma
Data from Glassnode has revealed that the Bitcoin supply is gradually dispersing from whales and exchanges to smaller hands with time.
Bitcoin Supply Is Slowly Showing Dispersal Towards Smaller Holders
According to a new report published by the on-chain analytics firm Glassnode, investors holding less than 50 BTC have recently absorbed the most significant volume of coins.
Something that BTC critics often hold up against the cryptocurrency is the distribution of the supply. They argue that the supply is heavily concentrated around a few whales, providing the existence of large wallets as evidence.
To check whether this fact holds, Glassnode studied the supply distribution of the market by breaking down investors into different cohorts. These holder groups are defined by the analytics firm as follows: shrimp (<1 BTC), crab (1-10 BTC), octopus (10-50 BTC), fish (50-100 BTC), dolphin (100-500 BTC), shark (500-1,000 BTC), whale (1,000-5,000 BTC), and humpback (>5,000 BTC).
The supplies held by exchanges and miners are also considered for the classification. A relevant indicator here is the “yearly absorption rates,” which measures the yearly change in the supplies of the different cohorts as a percentage of the total amount of issued coins (that is, the fresh supply miners produce).
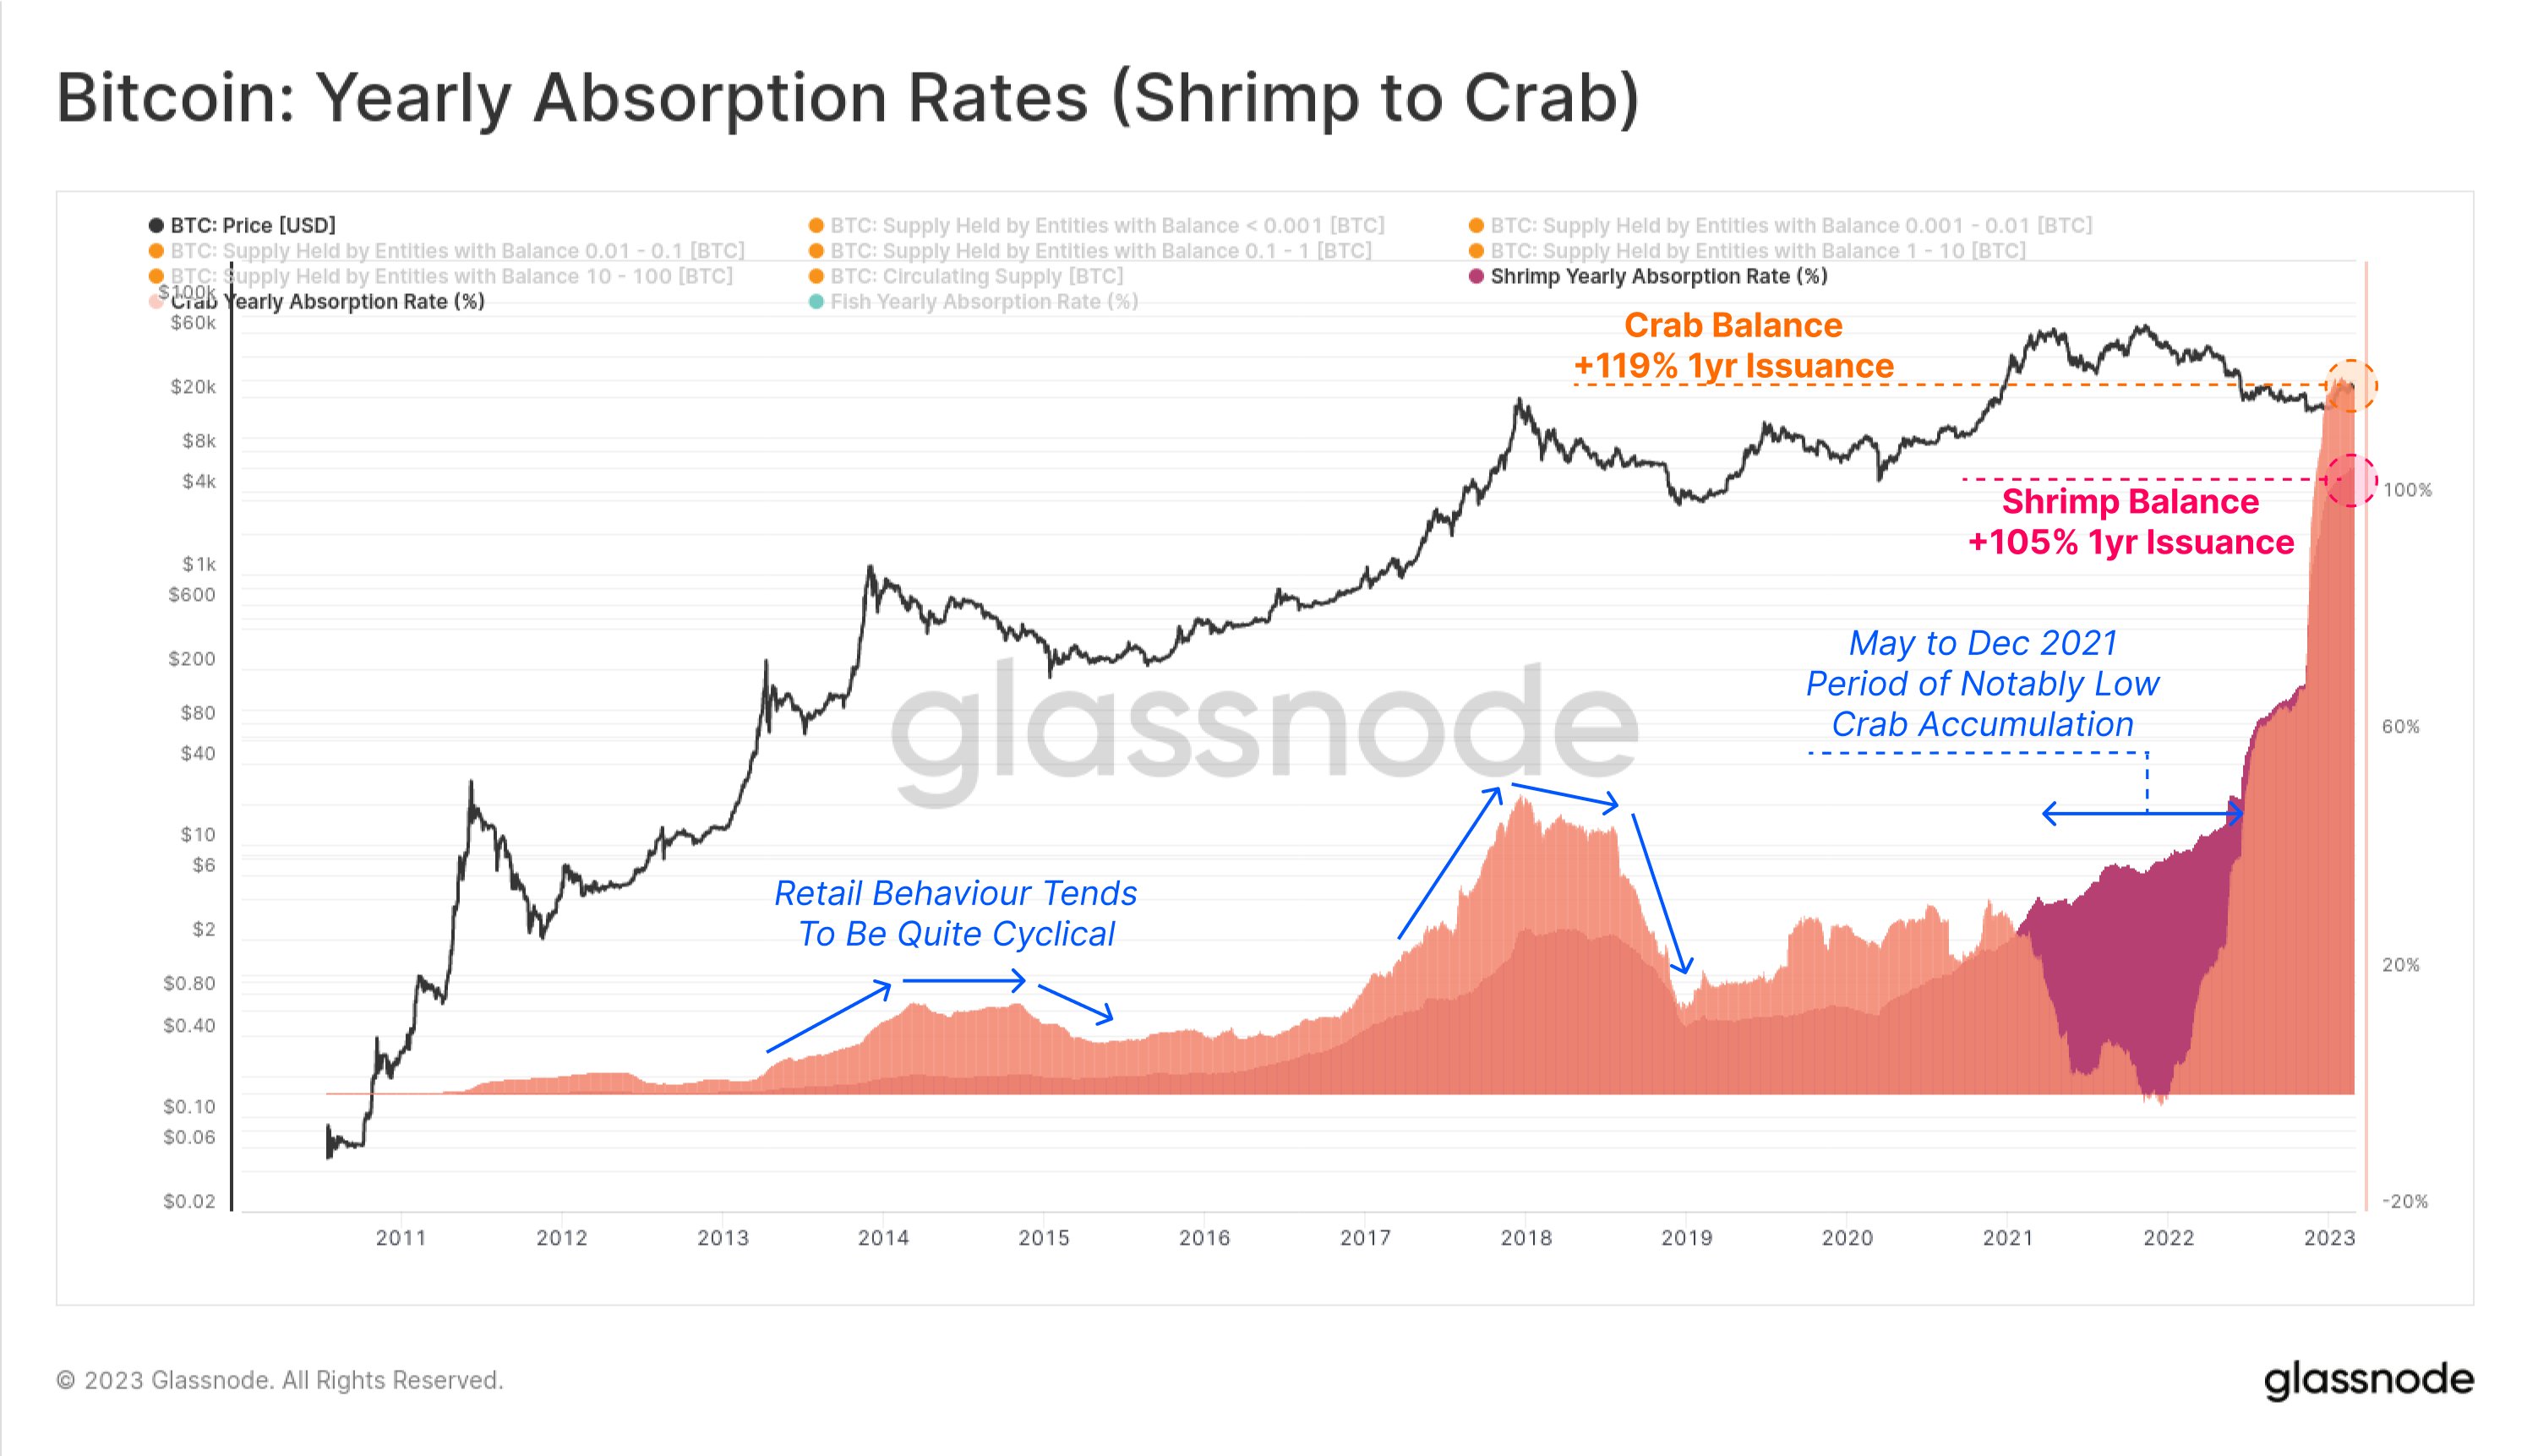
First, here is a chart that shows how the yearly absorption rates of shrimps and crabs have changed over the lifetime of the cryptocurrency:
Looks like the metrics have shown high values in recent days | Source: Glassnode
As displayed in the above graph, the Bitcoin shrimps and crabs have recently been observing all-time high absorption rates of about 105% and 119%, respectively.
This means that the supply held by the shrimps has grown by 105% of what miners produced during the past year, while the crabs have added an even more significant percentage at 119%.
Even if the BTC miners released 100% of what they mined the past year, these cohorts still have absorbed an extra supply. Where did these additional coins come from? The absorption rates of the other cohorts might hold the answer to it.

The absorption rates of the sharks and whales | Source: Glassnode
From the chart, it’s apparent that sharks have had a slightly positive yearly absorption rate recently. Still, the whales have seen a negative indicator value, implying that this cohort has been distributing during the past year.
The combined change in the supplies of both these cohorts is also a net negative since the distribution of the whales far outweighs whatever the sharks accumulated during this period.
Data for the absorption rates of the exchanges also shows negative values, implying that these platforms have released many coins into circulation.

The highly negative absorption rates shown by exchanges | Source: Glassnode
The smaller Bitcoin entities have been picking up the coins distributed by these cohorts. Interestingly, while this shift in the supply has been extreme recently, it’s a trend that has held up throughout the years.
As the chart below highlights, the supply held by smaller entities (with less than 50 BTC) has gradually gained dominance throughout the cryptocurrency’s history.

The rise of the shrimps and other small investors | Source: Glassnode
Though the share of the whales may have been quite significant at some point, today, their holdings have shrunk down to just 34.4% of the entire circulating supply, which, although still sizeable, is much lesser than the 62.7% around the time of the first halving, the events that cut downs BTC mining rewards in half, back in 2012.
The gradual supply shift also seems to be towards the smallest entities, which are the retail investors. This is a sign that cryptocurrency is becoming more dispersed as adoption increases.
BTC Price
At the time of writing, Bitcoin is trading around $24,300, up 10% in the last week.
BTC observes a pullback | Source: BTCUSD on TradingView
Featured image from Dmitry Demidko on Unsplash.com, charts from TradingView.com, Glassnode.com